See Tracknotion benefits in action
Insights you should have
TrackNotion’s analytics turn your incoming calls into actionable insights. From call volumes and peak times to Call Grading and keyword tracking, these tools help you understand your customers, tweak campaigns, and boost service—all in real time.
Note: You’ll need at least one campaign set up to use these features. New to campaigns? Click here to get started.
Once you’ve got a Static or Dynamic campaign running, TrackNotion unlocks a suite of analytics tools.
You'll find these under the Data section of the navigation menu. These dashboards provide data you can use to sharpen your marketing, improve customer interactions, and measure success.
Let’s break down the primary analytics tools.
Where: Left menu > Data > Campaign Overview

This dashboard gives you a snapshot of your campaign-driven calls. Filter by timeframe to see what’s happening and when.
Total Number of Calls
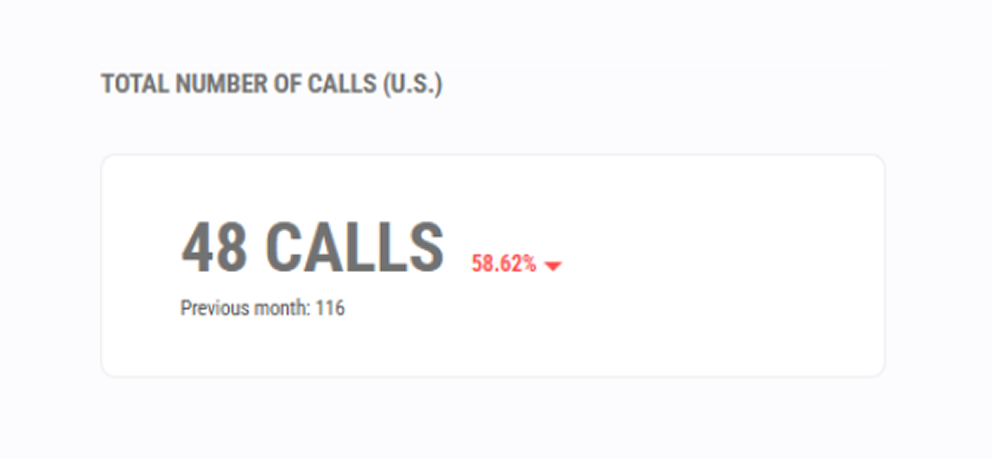
This panel shows the total call volume for your selected campaigns and time. A comparison to the previous period (shown as a percentage and a number) helps you track performance over time.
Why it helps:
Evaluate campaign success, identify trends, and optimize resource allocation for busy periods.
Unique Calls
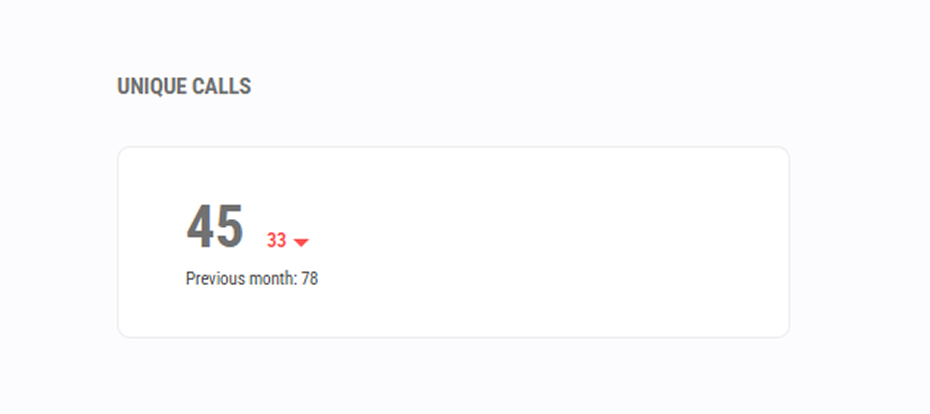
This metric measures how many distinct individuals have called you, rather than the total number of calls (which may include the same person-calling multiple times).
Why this helps:
Get a more accurate measure of your campaign's reach, assess new lead generation, and compare new vs. repeat callers.
Busiest Time
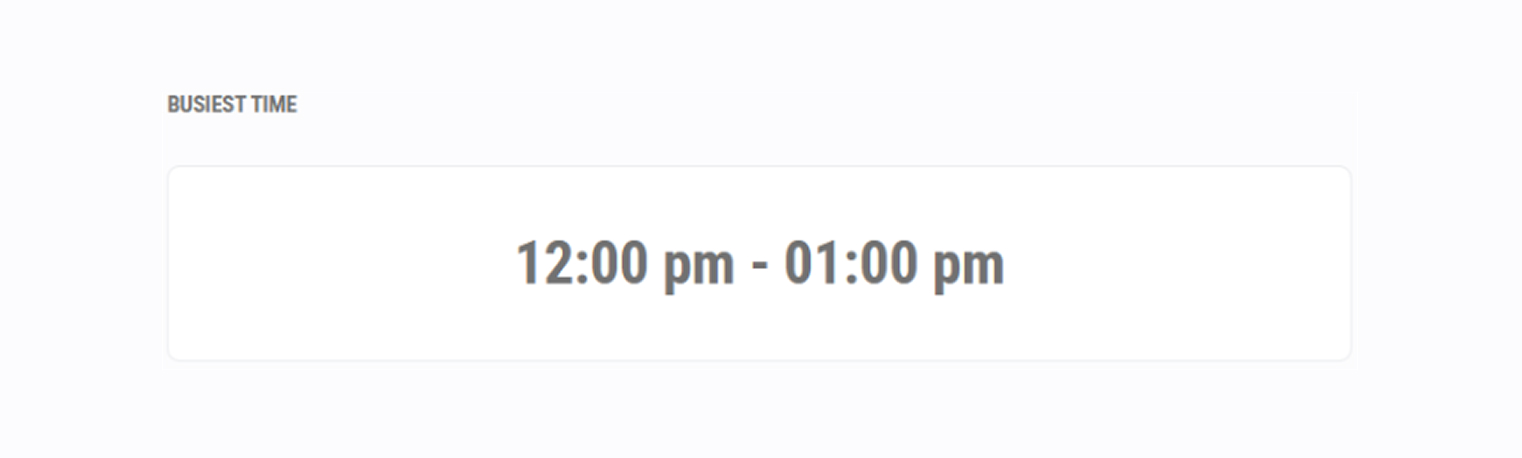
This panel identifies the single time block (e.g., 10:00 am - 11:00 am) that receives the most calls on average, based on your selected timeframe.
Why this helps:
Instantly see your peak hours to plan staffing, schedule ads for maximum engagement, and ensure your team is ready for the busiest part of the day.
Call Volume by Hour
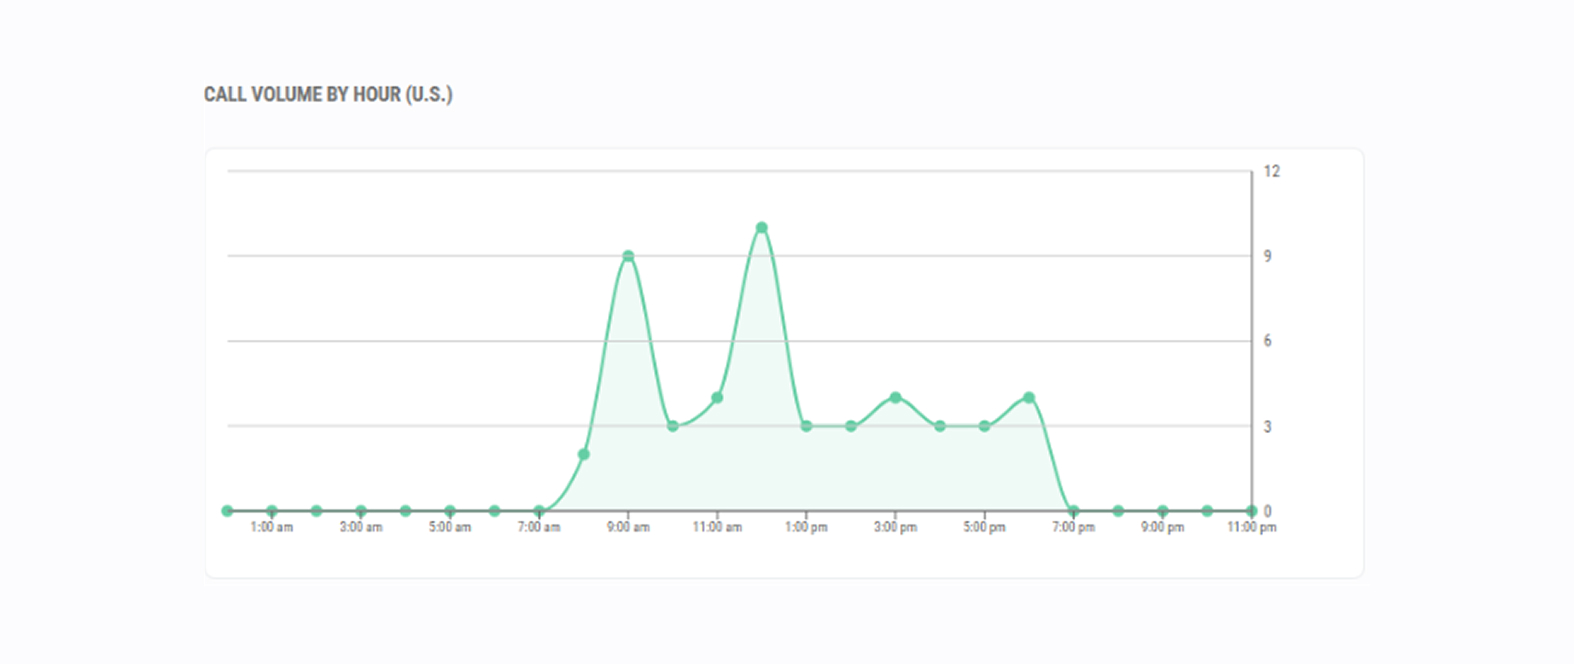
This graph provides a detailed breakdown of call activity across all hours of the day, showing your peaks and valleys.
Why this helps:
Optimize staff scheduling, align marketing promotions with high-traffic hours, and identify potential needs for after-hours support.
Average Call Grading
This gauge shows the average Call Grade from all analyzed calls in your selected timeframe, giving you a high-level snapshot of overall customer interaction quality.
Where: Left menu > Call Flows
Setup guide: Click here for help setting up call flows.
Manage your campaign call flows here. See all flows at once—perfect when juggling multiple campaigns.
This is particularly useful when you have set up multiple campaigns in your account, each with their unique call flows.
Why this helps:
Where:Left menu > Data > Call and Text Messaging Log

This dashboard is a detailed log of every call and text message interaction. You can use this log to review and assess individual interactions.

What you’ll see:
Date/Time: When the call happened.
Tracking Number: The phone number the campaign is assigned to.
Caller Info: The name and number of the caller, when available.
Recording: A securely stored audio recording of the call.
Duration: How long the call lasted.
Call Grading: The Call Grade (score) for the interaction, which analyzes the call's quality and outcome.
Keywords: Any monitored keywords that were identified during the call.
Call Transcript: A complete text record of the phone call.
UTM_Source: The originating source of the call (e.g., google, facebook).
UTM_Medium: The medium used (e.g., cpc, social).
Why this helps:
Enhance customer insights through transcripts and Call Grading, optimize campaigns by tracking UTM data, and improve staff training by reviewing specific call recordings.
Where: Left menu > Monitored Keywords

This dashboard is where you can set up and manage keywords to "listen" for in your calls. When a keyword is spoken, it is flagged in the Call and Text Messaging Log.
Why this helps:
Identify customer needs by tracking services or products, enhance quality assurance by flagging competitor names or words like "cancel," and refine marketing strategy by seeing what topics drive conversations.
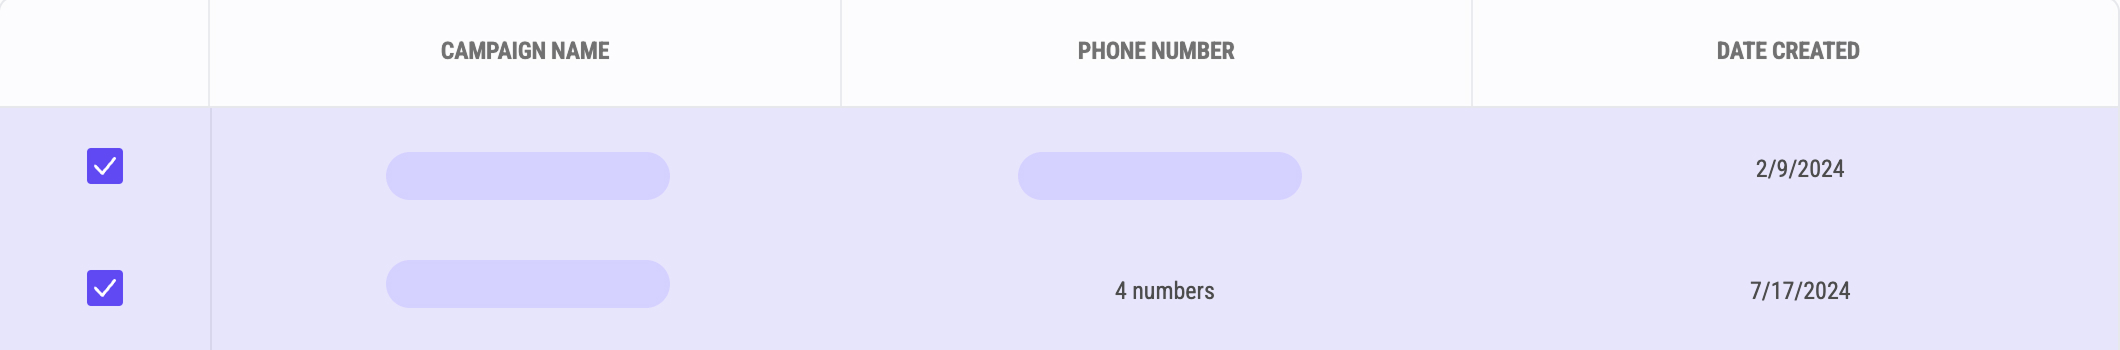
Where: Left menu > Compare Performance
This tool allows you to directly compare the performance of up to five different campaigns against each other.
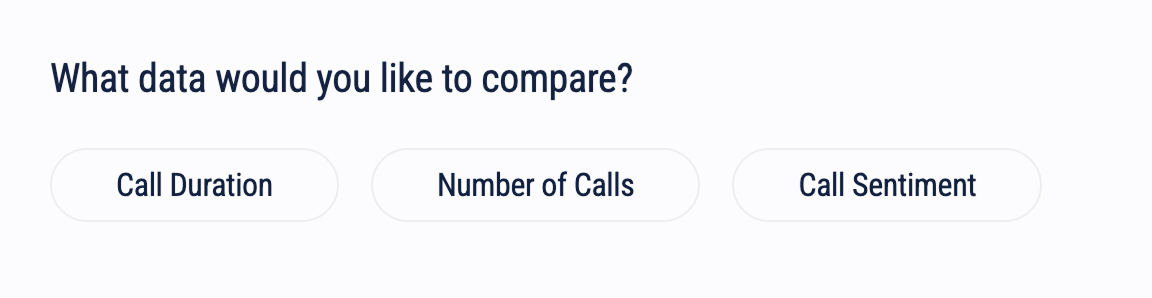
Once you select your campaigns, you can choose to compare them based on:
Call Duration
Number of Calls
Call Grading
Why this helps:
Evaluate campaign effectiveness, optimize resource allocation toward high-performing campaigns, and refine your targeting strategies by seeing which messages resonate most.
Each panel has its own set of filters that you can apply to segment the types of information you want to display. This makes it easier for you to work through specific data, depending on which panel you are using.
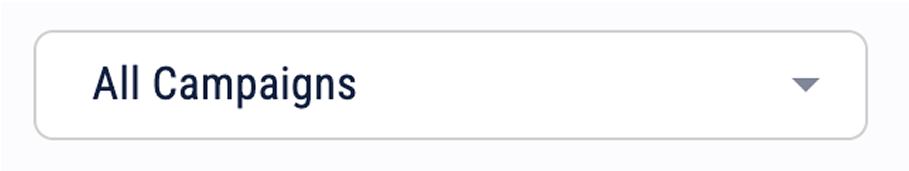
Campaign Selector: Allows you to view data from a specific campaign, or all of them.
Date Range: The date range filter allows you to see metrics within a specific date range.
Time Range: View details from a specific time.
Call Grading: Filter calls that fall within a specific score range.
Call Duration: Filter calls by their duration.
Search Fields: Search for specific details about a call/campaign/keyword.
Why this helps:
TrackNotion’s analytics tools provide a comprehensive view of your call performance. By analyzing key metrics such as call volume, unique callers, Call Grading, and keyword monitoring, you can make data-driven decisions, enhance customer service, and prove the ROI of your marketing campaigns.