In the healthcare industry, patient experience and operational efficiency go hand in hand. For call centers supporting hospitals, clinics, and private practices, understanding how your team performs isn’t optional; it’s essential.
Consider this: 70% of patients expect immediate service, and a poor phone experience can lead to 65% of patients switching to a different provider.
Every single call is a vital touchpoint – from scheduling appointments to clarifying complex medical information or addressing urgent concerns.
When calls are missed, poorly handled, or lead to frustrating wait times, the costs are immense: lost patient acquisition, increased no-shows, negative reviews, and ultimately, a damaged reputation and reduced revenue.
Tracking the right call center metrics helps healthcare organizations not only avoid these pitfalls but also boost patient satisfaction, streamline operations, and optimize staff performance.
Here are the 10 most important healthcare call center metrics every organization should monitor to drive better outcomes.
Patient Experience & Service Quality Metrics
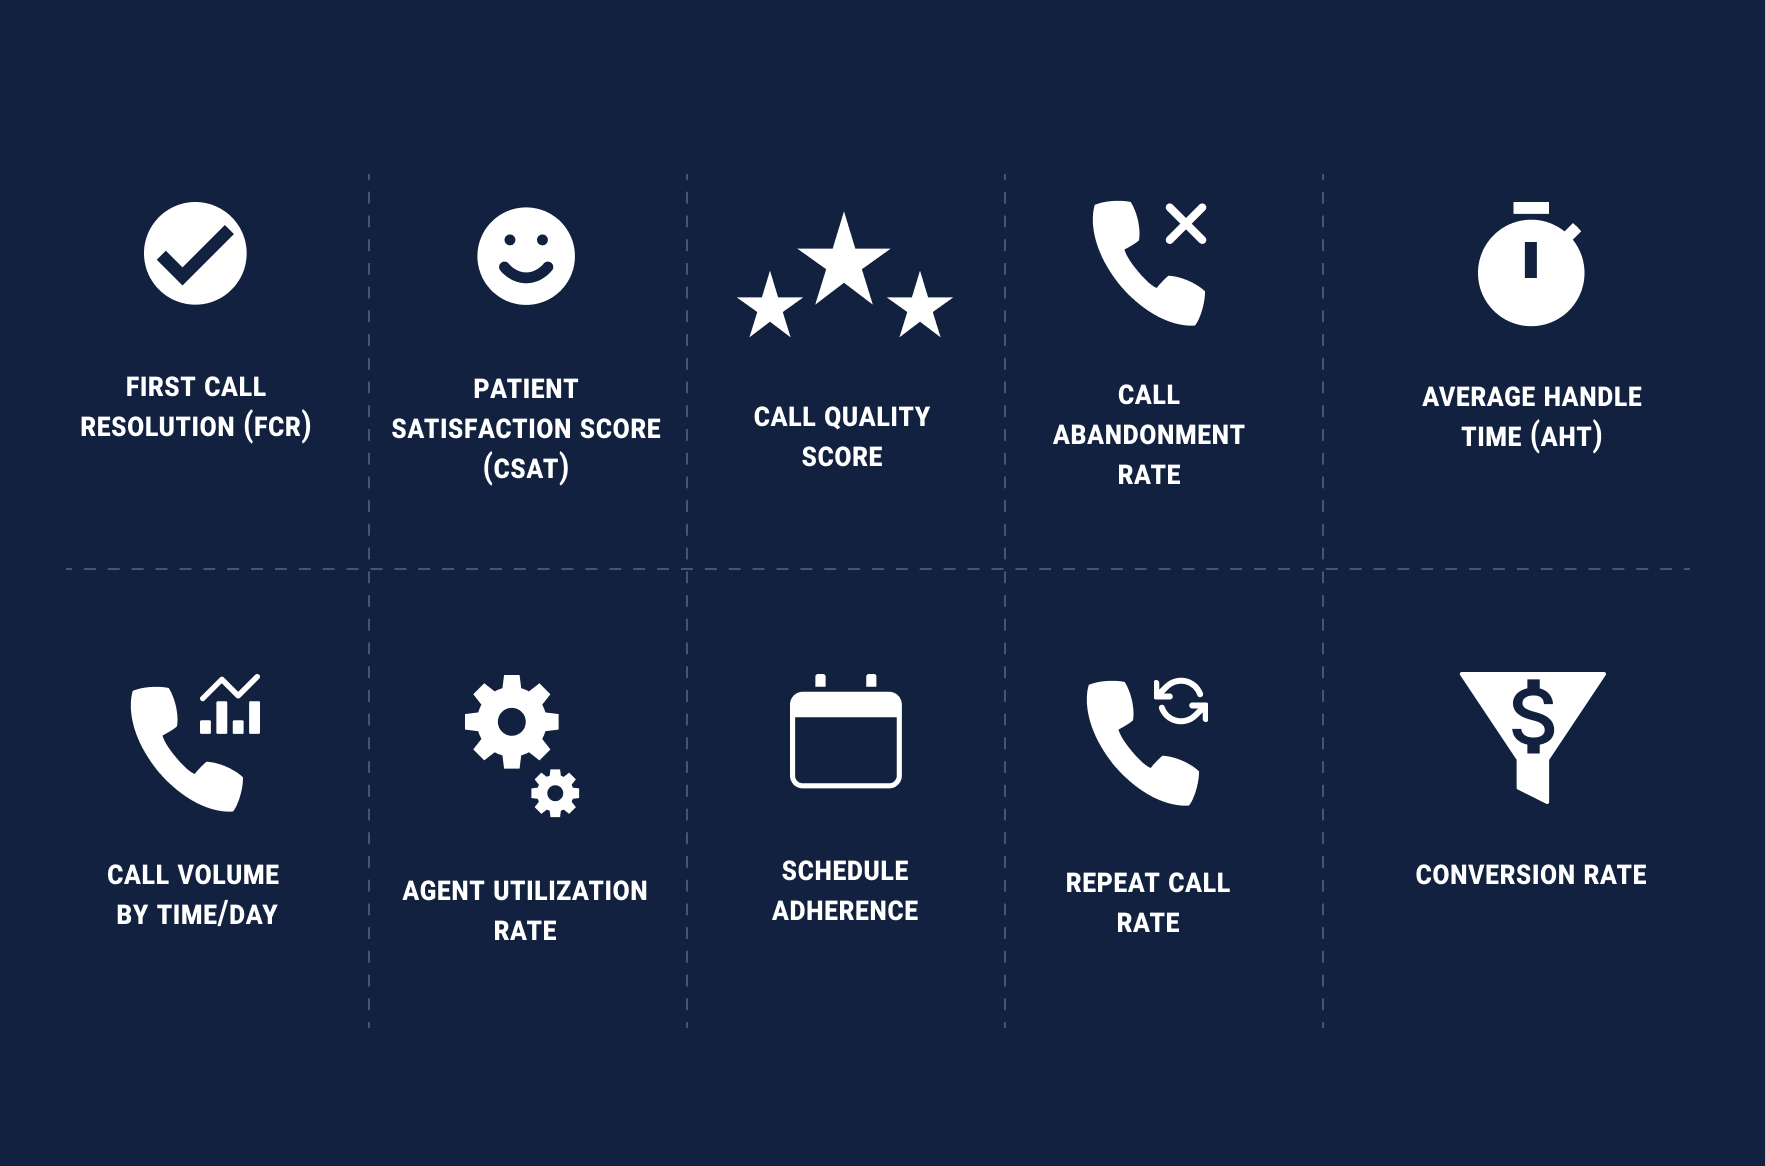
1. First Call Resolution (FCR)
What it is: This metric measures how often patient concerns are resolved in a single call without requiring a transfer or follow-up
Patients value fast, effective service, especially when dealing with medical needs. High FCR is directly linked to improved patient satisfaction and reduced overall call volume, as patients don't need to call back for the same issue.
For healthcare, where timely and accurate information can be critical, FCR builds trust and prevents escalation.
In healthcare, a strong FCR typically ranges from 75% to 85%.
How to measure:
- Calculation: (Number of issues resolved on first contact / Total number of issues) x 100%
- Practicality: Implement brief post-call surveys asking "Was your issue resolved on this call?" or "Did you need to call back regarding this matter?" You can also track if an agent logged a follow-up action or if the same patient called back within a defined period (e.g., 24-48 hours) for the same issue.
Quantifying business impact:
- Increased Patient Loyalty: A 1% increase in FCR can lead to a 1% increase in patient satisfaction, significantly improving loyalty.
- Reduced Operational Costs: Fewer callbacks mean reduced agent workload, potentially saving on staffing costs.
- Enhanced Reputation: Patients satisfied with immediate resolution are more likely to provide positive reviews and refer others.
- Interconnectedness: High FCR often leads to better Patient Satisfaction Scores (CSAT) and a lower Repeat Call Rate. It also impacts Average Handle Time (AHT) – sometimes a slightly longer, more thorough call leads to better FCR.
2. Patient Satisfaction Score (CSAT)
What it is: After-call surveys asking patients to rate their experience provide a direct view into how your team is performing from the patient's perspective.
CSAT is a leading indicator of patient loyalty and trust. High satisfaction reduces churn, encourages positive word-of-mouth, and directly contributes to a positive brand image in a patient-first healthcare landscape.
For healthcare, aiming for 85% or higher CSAT is generally considered excellent.
How to measure:
- Calculation: (Number of satisfied patients (e.g., 4 or 5 on a 5-point scale) / Total respondents) x 100%.
- Practicality: Send surveys via text message or email immediately after a call. Keep questions concise, focusing on the specific interaction. "How satisfied were you with the assistance you received today?" is a common question.
Quantifying business impact:
- Higher Patient Retention: Satisfied patients are more likely to return for future care.
- Increased Referrals: Positive experiences translate to valuable patient referrals.
- Improved Online Reviews: High CSAT often correlates with better online ratings, drawing new patients.
Interconnectedness: CSAT is influenced by nearly all other metrics, especially FCR, low Call Abandonment Rate, and good Call Quality Score.
3. Call Quality Score
What it is: This score is often assigned by QA teams based on script adherence, empathy, compliance, and accuracy during the call.
Call quality monitoring helps ensure agents are communicating clearly, empathetically, and staying compliant with stringent healthcare regulations like HIPAA. It directly impacts patient safety, satisfaction, and your organization's legal standing.
Industry Benchmarks: Aim for an average call quality score of 80-90% across your team.
How to measure:
- Calculation: Typically qualitative, based on a rubric/scorecard. (Sum of scores on criteria / Total possible score) x 100%.
- Practicality: QA specialists or supervisors regularly review a sample of recorded calls against a predefined scorecard that assesses factors like professionalism, accuracy, empathy, active listening, and adherence to protocols.
Quantifying business impact:
- Reduced Errors & Risks: High quality minimizes miscommunications, leading to fewer medical errors and compliance breaches, preventing costly penalties.
- Enhanced Patient Trust: Professional and empathetic communication fosters patient trust, encouraging adherence to treatment plans and loyalty.
- Improved Agent Performance: Direct feedback from quality scores leads to targeted training and overall agent improvement.
Interconnectedness: High Call Quality Score contributes significantly to high FCR and CSAT, and reduces the Repeat Call Rate.
4. Call Abandonment Rate
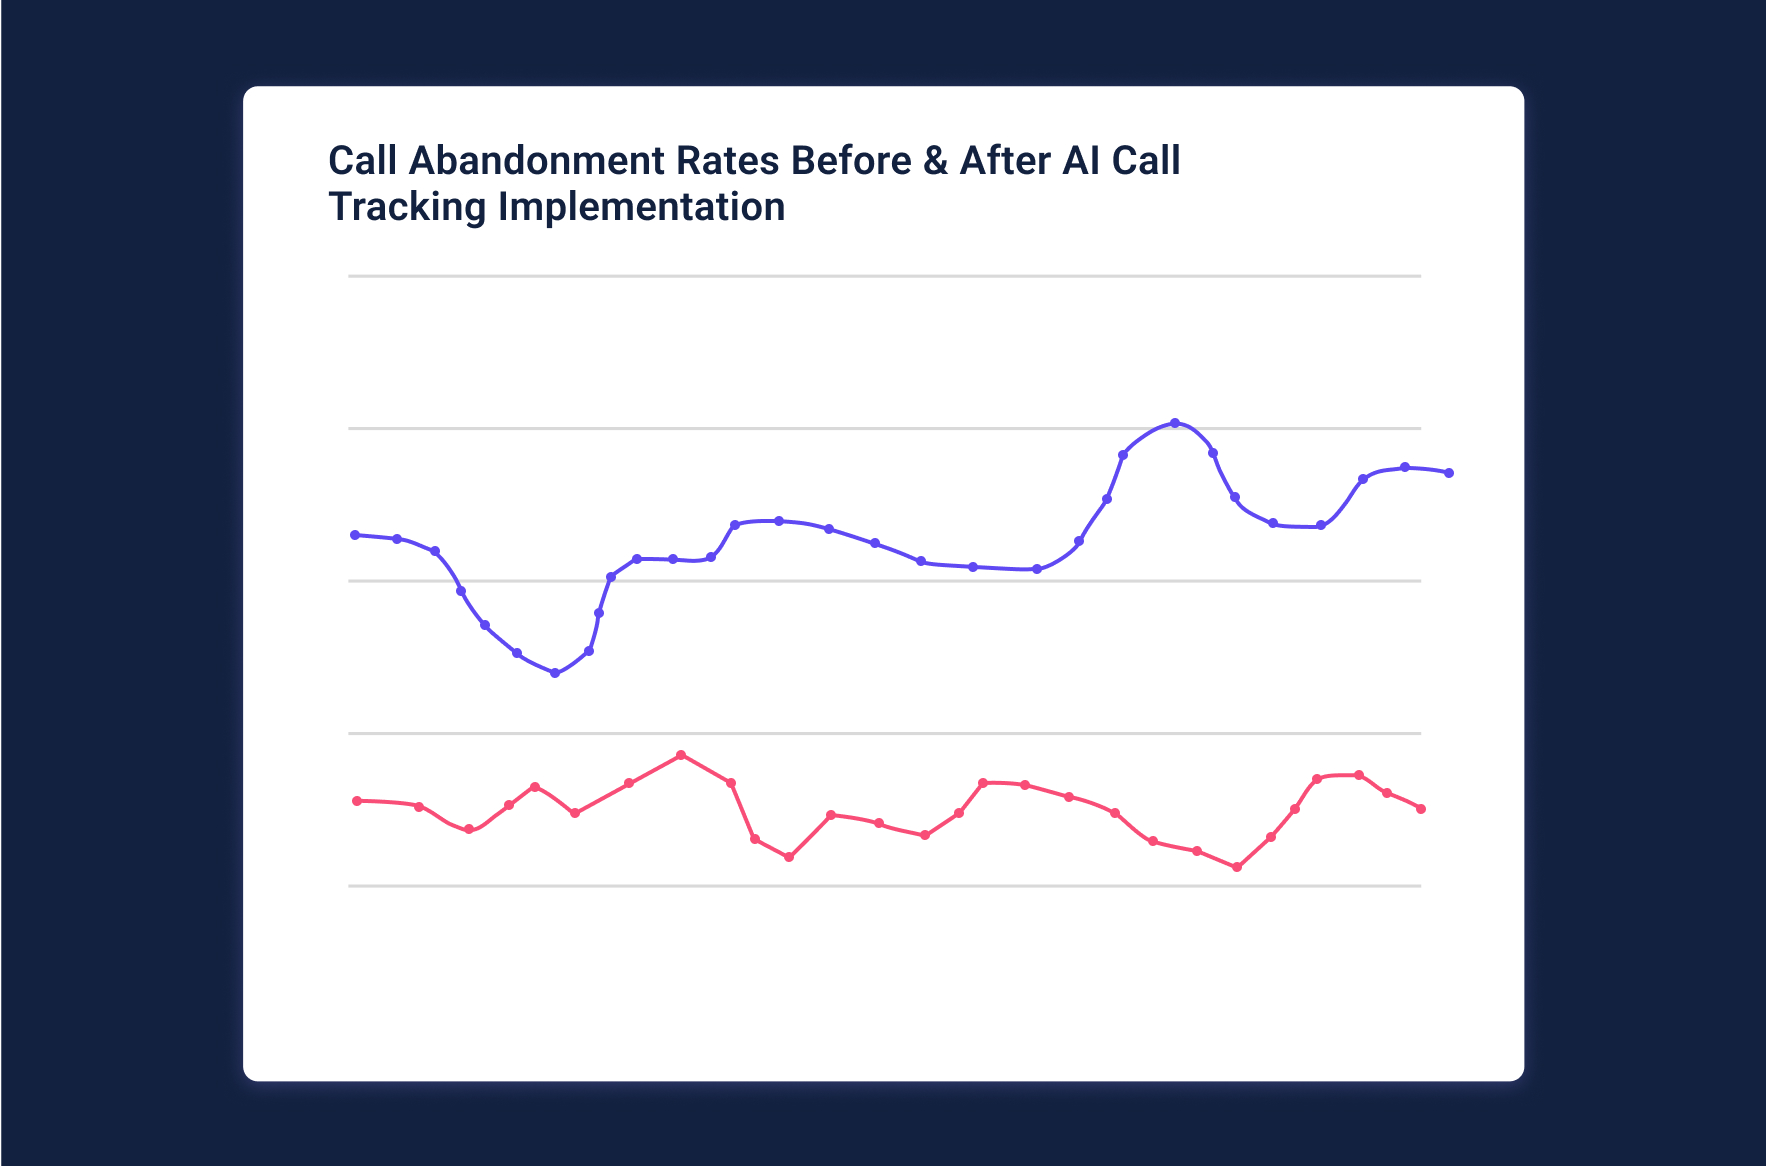
What it is: This represents the percentage of patients who hang up before reaching an agent.
In healthcare, where timing can be critical for urgent needs, a high abandonment rate can damage trust, delay care, and lead to patients seeking services elsewhere. It’s often a sign you need more staff coverage during peak hours.
A healthy abandonment rate for healthcare call centers is typically under 5%, with world-class centers aiming for 2-3%.
How to measure:
- Calculation: (Number of abandoned calls / Total incoming calls) x 100%.
- Practicality: Your call center system automatically tracks this. Analyze trends by time of day, day of week, or specific campaigns to identify root causes. Exclude "short abandons" (e.g., under 10 seconds), which are often misdials.
Quantifying business impact:
- Direct Revenue Loss: Each abandoned call is a lost opportunity for an appointment, procedure, or service, leading to significant revenue loss.
- Reputation Damage: Frustrated patients are unlikely to try calling again and may leave negative reviews.
- Wasted Marketing Spend: If marketing efforts drive calls that are then abandoned, that marketing budget is inefficiently spent.
Interconnectedness: High abandonment is a direct consequence of low Service Level (long wait times) and insufficient Agent Utilization or Schedule Adherence.
Operational Efficiency & Workforce Metrics
These metrics focus on how effectively your call center manages its resources and workflows to deliver timely patient service.
5. Average Handle Time (AHT)
What it is: AHT tracks how long agents spend on each call, including hold and talk time.
While shorter isn’t always better in healthcare (quality is paramount), excessively long calls may indicate a lack of training, workflow inefficiencies, or complex patient issues that require process streamlining. Optimized AHT ensures efficient patient flow.
Healthcare AHT can vary widely based on call complexity (e.g., simple appointment vs. complex billing). A general benchmark is 4-7 minutes, but this should be internally optimized for your specific call types.
How to measure:
- Calculation: (Total Talk Time + Total Hold Time + After-Call Work Time) / Total Number of Calls.
- Practicality: Call center software automatically logs talk and hold times. Ensure agents accurately log "after-call work" (ACW) time (e.g., updating patient records, scheduling follow-ups). Regularly review ACW tasks for potential automation.
Quantifying business impact:
- Cost Efficiency: Labor costs are a significant part of call center operations. Optimizing AHT can lead to substantial savings.
- Increased Capacity: A lower AHT means agents can handle more calls, potentially reducing Call Abandonment Rate and improving Service Level.
- Resource Planning: Historical AHT data helps forecast staffing needs and maintain appropriate agent levels.
Interconnectedness: AHT must be balanced with FCR and Call Quality. Rushing calls to lower AHT can compromise resolution and patient satisfaction.
6. Call Volume by Time/Day
What it is: Tracking when your call center is busiest helps you identify peak periods and optimize staffing schedules to meet demand.
Better alignment between staff availability and call demand improves responsiveness, reduces patient wait times, and helps maintain a consistent Service Level. It’s critical for efficient resource allocation and preventing agent burnout during peak hours.
This is highly specific to each organization, but the goal is to see demand patterns clearly.
How to measure:
- Calculation: Total calls received during a specific time interval (e.g., 9 AM - 10 AM) over a defined period (e.g., a week or month).
- Practicality: Most call center platforms provide this data automatically through historical reports. Visualize this data in heatmaps or bar charts to easily spot trends.
Quantifying business impact:
- Optimized Staffing Costs: Avoid overstaffing during slow periods and understaffing during busy times.
- Improved Patient Access: Ensure patients can reach someone when they need to, reducing Call Abandonment.
- Enhanced Agent Morale: Distribute workload more evenly, reducing stress during surges.
Interconnectedness: Directly impacts Service Level, Call Abandonment Rate, and Agent Utilization Rate.
7. Agent Utilization Rate
What it is: This measures how much time agents spend actively handling calls versus idle or administrative time
High utilization may indicate burnout risk, leading to decreased performance and attrition. Low utilization can point to scheduling inefficiencies or a need for more administrative tasks during downtime. The goal is a healthy balance.
A healthy range for agent utilization in healthcare call centers is typically 60-80%, allowing for breaks, training, and non-call work.
How to measure:
- Calculation: (Total productive time / Total available time) x 100%. Productive time includes talk time, hold time, and after-call work.
- Practicality: Leverage your call center software to track agent states (on call, available, wrap-up, break). This provides the data needed for the calculation.
Quantifying business impact:
- Cost Efficiency: Optimized utilization means you're getting the most out of your labor investment without overworking staff.
- Improved Service Consistency: Well-utilized agents are less likely to be stressed or burned out, leading to better service quality.
- Better Workforce Planning: Understand true capacity to accurately forecast staffing needs.
Interconnectedness: Directly linked to Service Level (high utilization might mean longer waits) and Schedule Adherence.
8. Schedule Adherence
What it is: This metric tracks whether agents follow their assigned schedules, including punctuality, break timing, and shift availability.
Poor adherence means missed calls, longer wait times, and a ripple effect of inefficiency across the call center. High adherence ensures consistent coverage and patient access.
Aim for 85-95% schedule adherence.
How to measure:
- Calculation: (Actual time worked / Total scheduled time) x 100%.
- Practicality: Workforce management (WFM) or call center software typically provides real-time adherence (RTA) monitoring, showing if agents are in the correct state at the correct time.
Quantifying business impact:
- Improved Service Level: Direct correlation – better adherence means staff are available when needed, reducing wait times.
- Reduced Overtime Costs: Consistent staffing prevents the need for last-minute overtime to cover gaps.
- Fair Workload Distribution: Prevents agent burnout from constantly covering for colleagues.
Interconnectedness: Crucial for maintaining desired Service Levels and optimizing Agent Utilization Rate.
Outcome & Growth Metrics
These metrics reveal how effectively your call center drives tangible business results and supports organizational growth.
9. Repeat Call Rate
What it is: If patients are calling back multiple times about the same issue, it may indicate a process failure or communication breakdown.
A low repeat call rate supports FCR and patient confidence in your care team. High repeat calls signify inefficiency, patient frustration, and can inflate call volume unnecessarily.
Target a repeat call rate of under 15-20% for the same issue within 7 days..
How to measure:
- Calculation: (Number of unique patients calling back within a set timeframe for the same issue / Total number of calls) x 100%
- Practicality: Requires linking inbound calls to patient IDs or unique phone numbers and tracking the reason for each call. Post-call surveys can also ask if the patient is calling about a previous issue.
Quantifying business impact:
- Reduced Operational Burden: Fewer repeat calls free up agents to handle new inquiries.
- Improved Patient Experience: Patients appreciate efficient resolution without needing multiple contacts.
- Enhanced Data Accuracy: Indicates that information provided during the first call was sufficient and accurate.
Interconnectedness: A high repeat call rate often points to issues with FCR and Call Quality.
10. Conversion Rate (Appointments Scheduled or Services Rendered)
What it is: Ultimately, the goal of many healthcare call centers is to book appointments, register patients, or facilitate services. This metric tracks the percentage of valuable calls that achieve a desired outcome.
Tracking conversion rates gives you insight into how effectively your call center supports your organization’s growth and care objectives. It directly links call center performance to the bottom line.
Highly variable by service and call type. A common benchmark for new patient appointment scheduling could range from 20-40% depending on the lead source and service.
How to measure:
- Calculation: (Number of successful conversions / Total number of relevant inbound calls) x 100%.
- Practicality: Requires integration between your call tracking/monitoring system and your scheduling or EHR system to accurately log when a call results in a booked appointment or registered service. Agents must accurately log call outcomes.
Quantifying business impact:
- Direct Revenue Growth: Higher conversion rates directly translate to more booked appointments and increased revenue.
- Optimized Marketing ROI: By knowing which calls convert, you can refine marketing strategies to drive more high-value calls.
- Improved Agent Sales/Scheduling Skills: Identifies agents who are most effective at converting calls into actual services.
Interconnectedness: The ultimate outcome metric, influenced by the effectiveness of all other metrics (e.g., high CSAT and FCR will likely lead to higher conversion rates).
Bonus: How AI and Call Tracking Enhance Call Center Performance
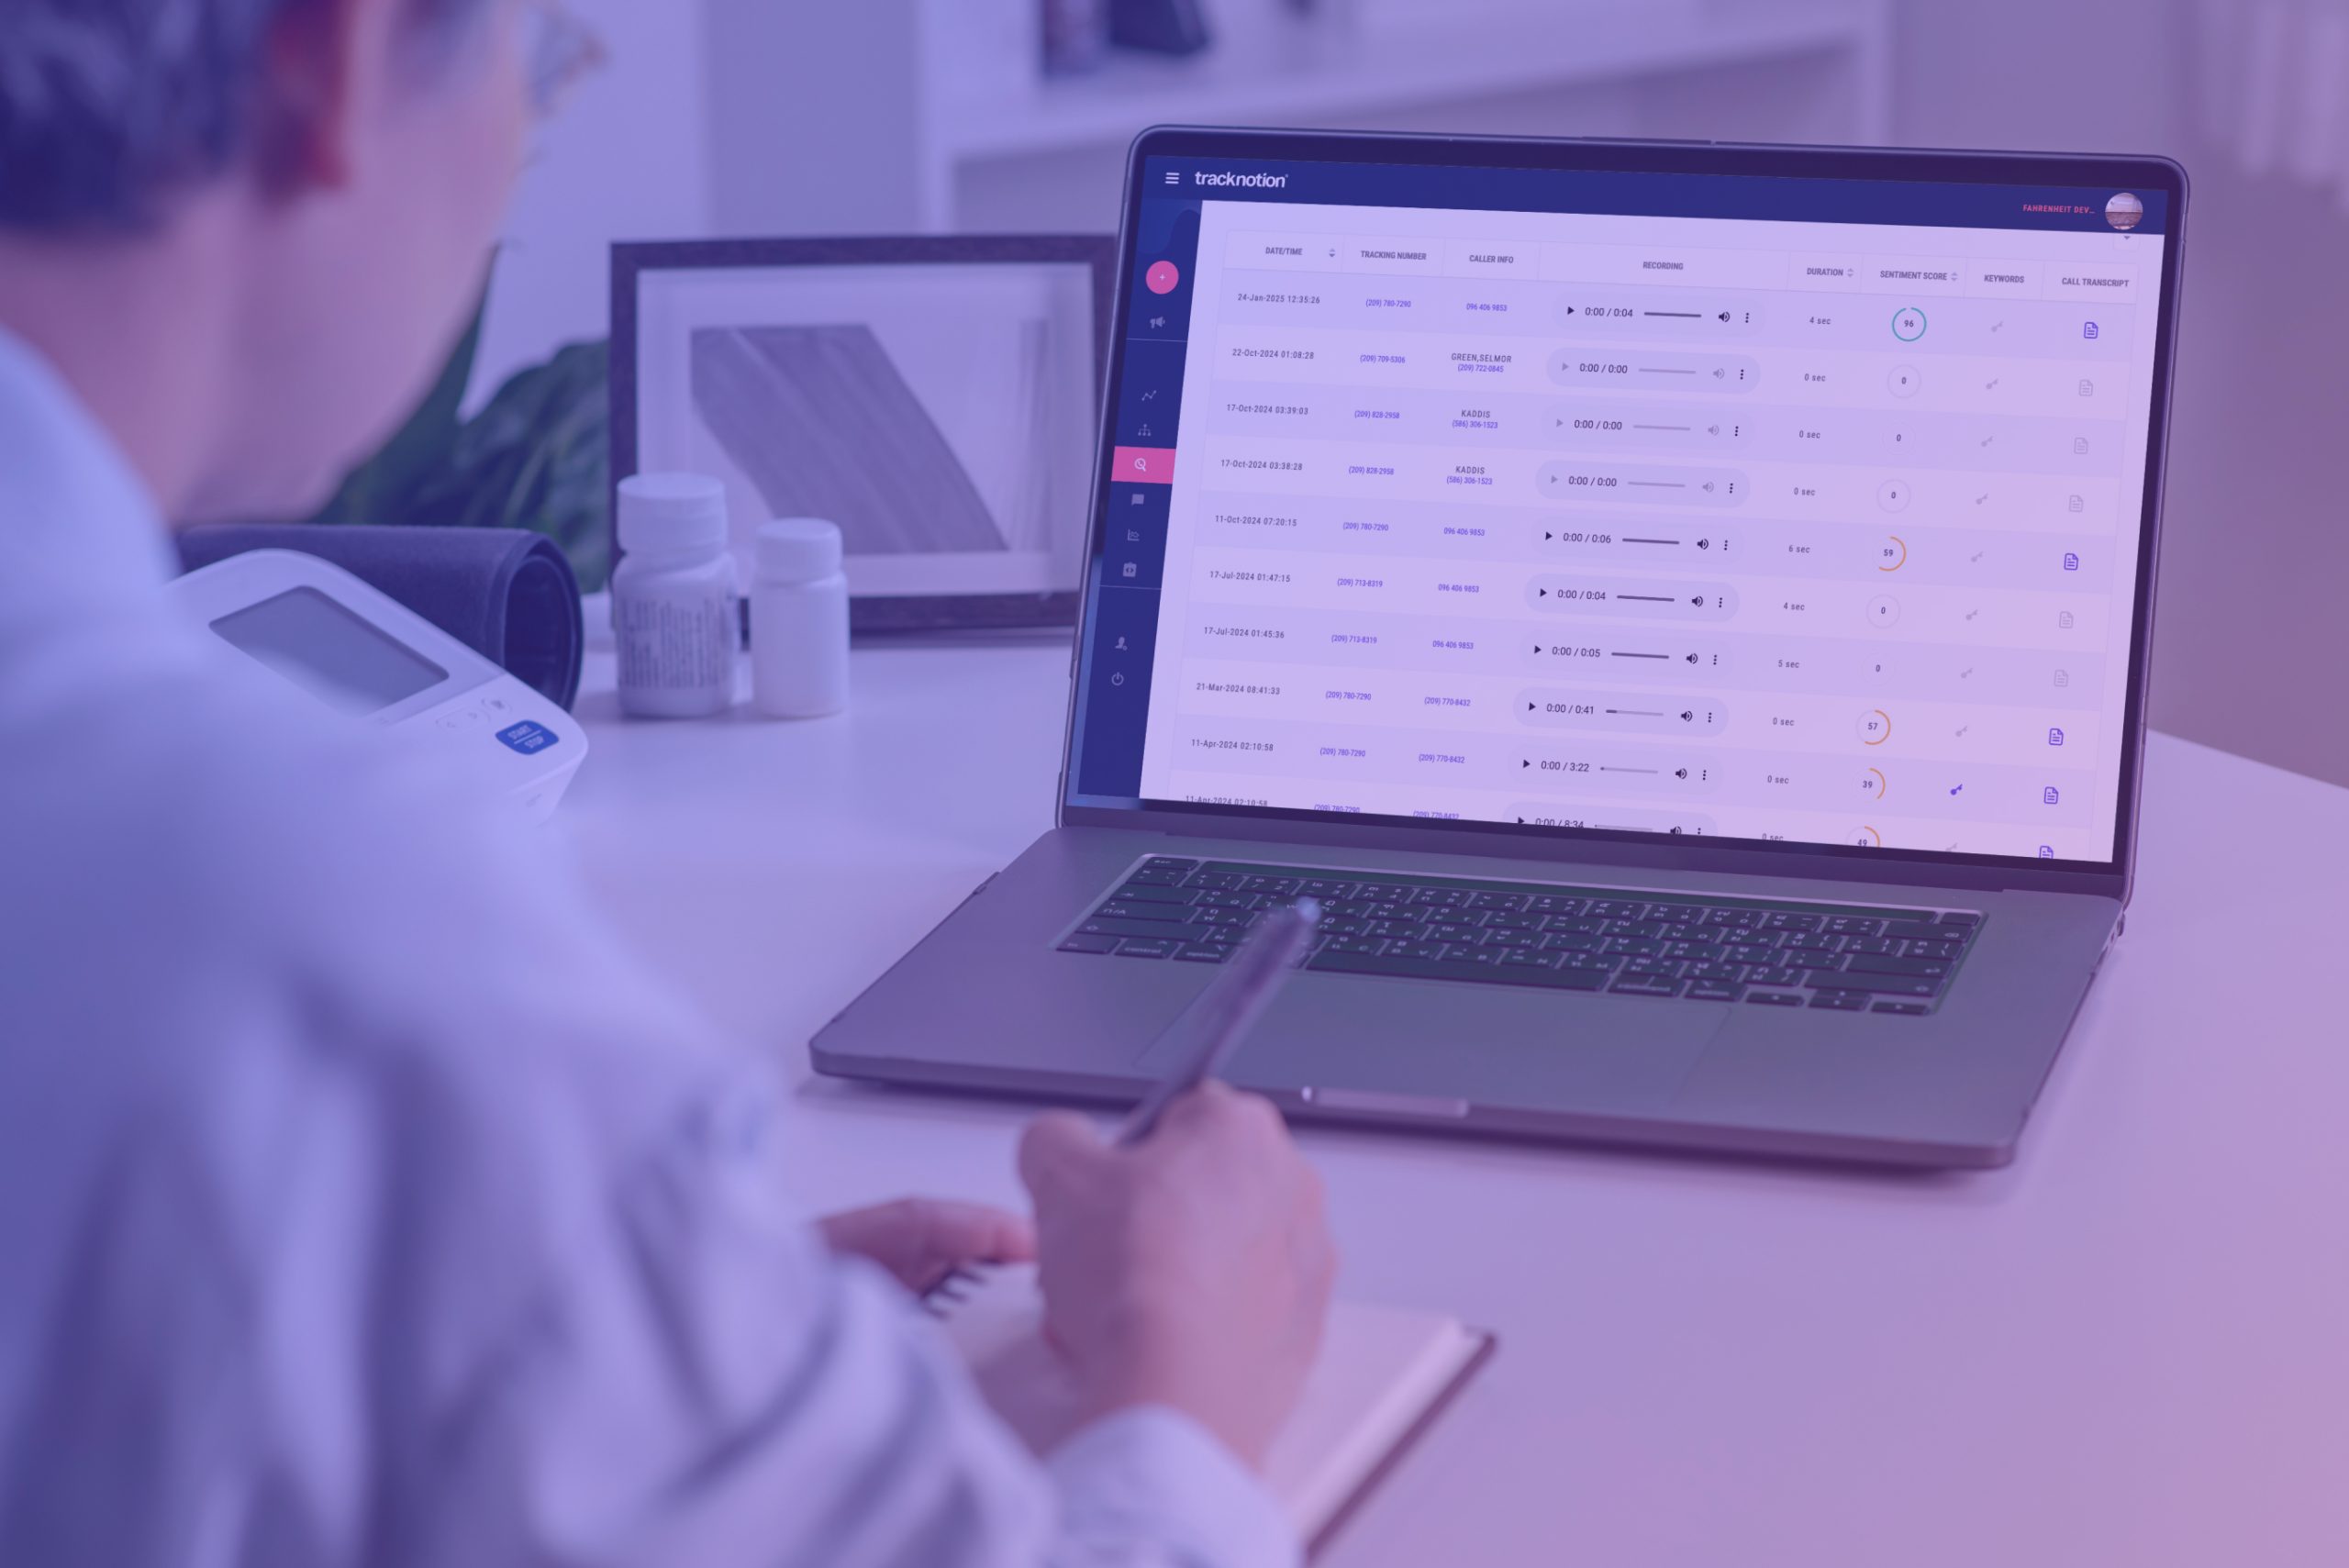
Traditional metrics provide a solid foundation, but combining them with AI-powered tools like TrackNotion unlocks the next level of performance.
These advanced capabilities allow healthcare providers to not just measure, but actively improve their call center operations.
Real-time Call Grading for Proactive Intervention: TrackNotion's AI can detect when a call is going poorly, even before it ends. If a patient's tone shifts to frustration or anger, the system can alert a supervisor.
- Example: A patient is discussing a recent bill, and the AI detects rising negative sentiment. A supervisor can "whisper coach" the agent in real-time or prepare to intervene, preventing a negative experience from escalating into a formal complaint or lost patient.
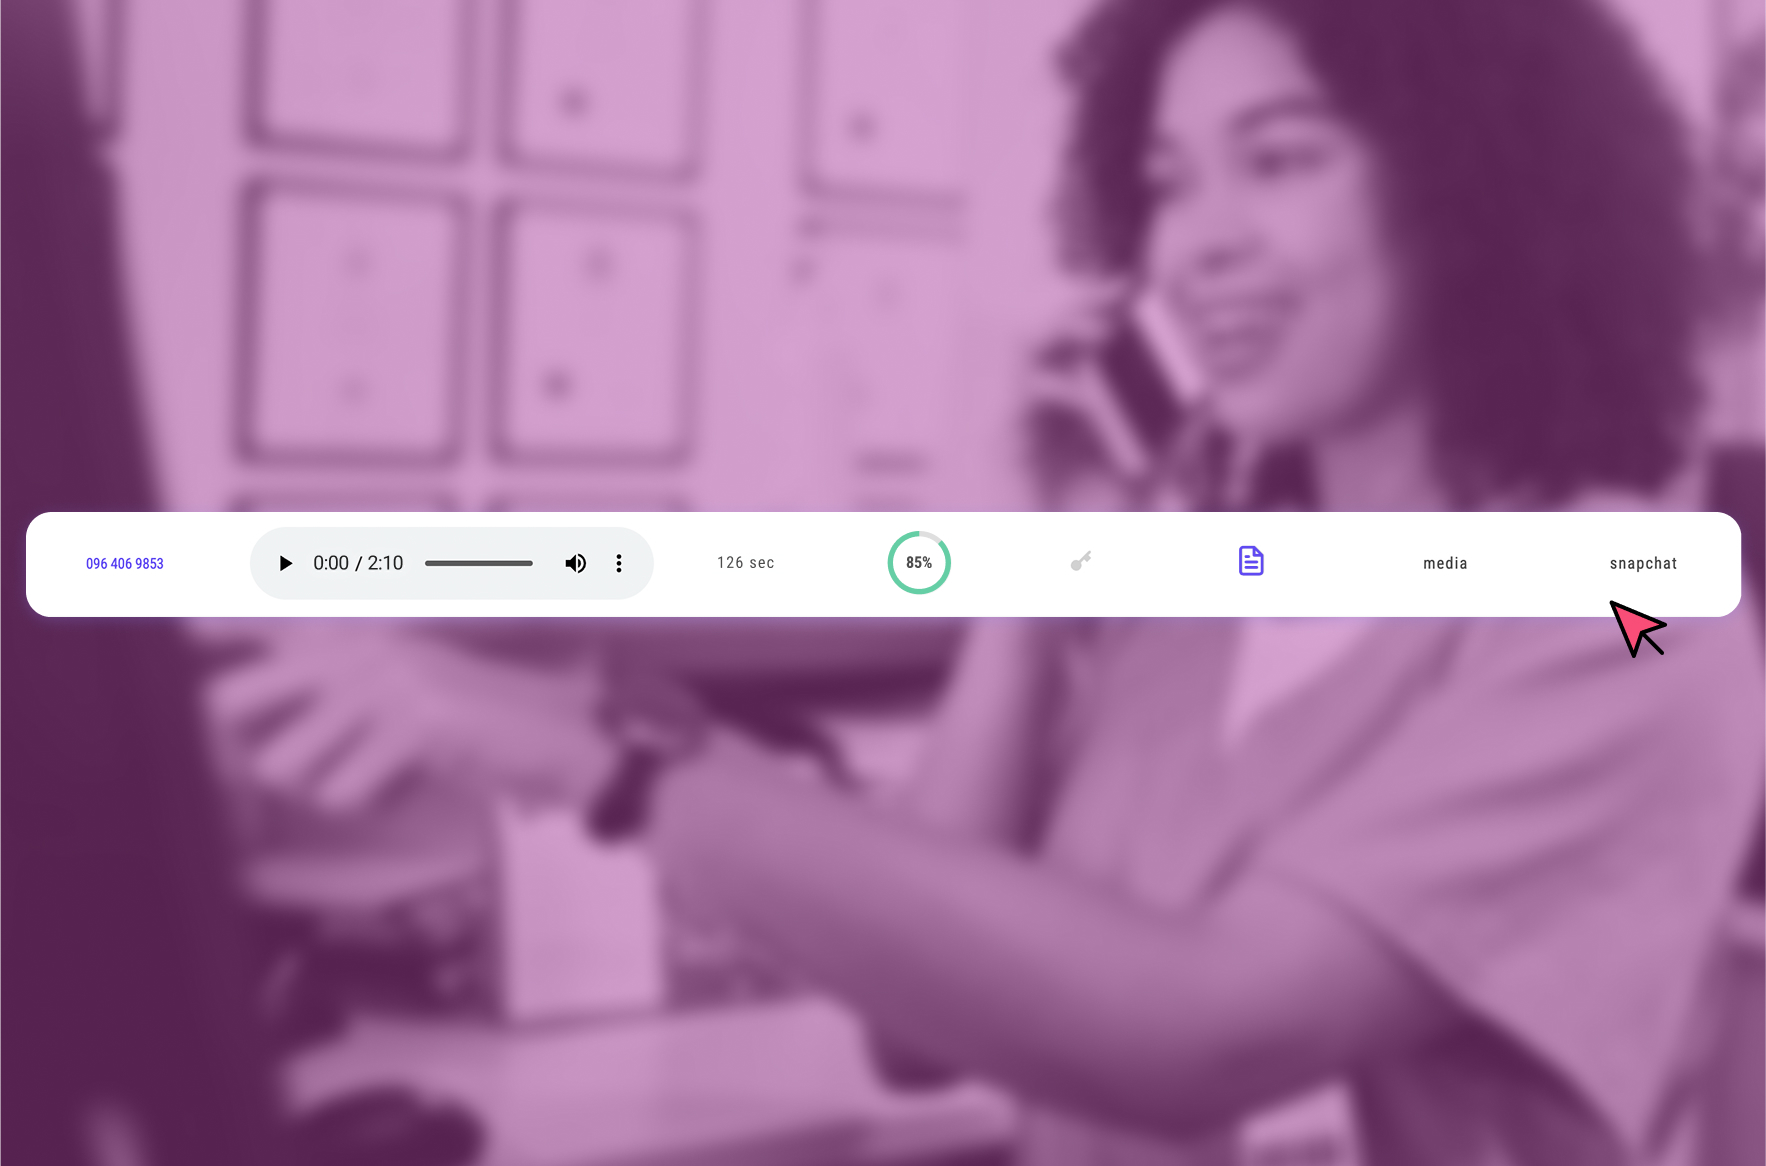
Automated Call Scoring for Rapid Training & FCR Improvement: Instead of manually reviewing calls, TrackNotion can automatically transcribe conversations and score them based on keywords and sentiment.
- Example: For FCR, if a call transcript contains "resolved issue" and "thank you" with positive sentiment, it's automatically flagged as a successful resolution. If it contains "call me back" and negative sentiment, it's flagged as an FCR failure, providing immediate coaching opportunities.
Precision Keyword Alerts for Critical Issue Identification: Set up alerts for specific phrases critical in healthcare.
- Example: "Prescription error," "allergic reaction," "billing dispute," or "urgent appointment." These alerts can prioritize calls for specific specialists or ensure immediate follow-up, enhancing patient safety and reducing risk.
Seamless CRM Integration for Unified Patient Profiles: Connect call outcomes, transcripts, and grading directly with your Electronic Health Records (EHR) or CRM.
- Example: A patient calls about a new symptom. The call is transcribed, and AI flags "chest pain" and "emergency." This information is automatically logged in their patient file, ensuring any subsequent medical staff have full context, improving continuity of care. This also links the marketing source of the call to the ultimate patient outcome.
With TrackNotion’s AI-powered platform, healthcare providers can monitor these call center metrics in real-time, automate reporting, and take data-driven action to improve both care and efficiency.
Final Thoughts
In today’s patient-first healthcare landscape, delivering exceptional call center service is a competitive advantage. By consistently measuring and acting on these 10 healthcare call center metrics, your organization can improve patient outcomes, operational effectiveness, and staff morale.
These metrics, combined with the power of AI-driven call tracking, provide the insights needed to not just react to patient needs but to proactively enhance their entire experience and drive the sustainable growth of your practice.
Want to improve your healthcare call center’s performance?
Sign up for a free trial of TrackNotion today to see how intelligent call tracking and AI insights can transform your communication strategy.